Understanding Japanese candlestick pattern formation: A Deep Dive into Their Structure and Significance
Hello friends! Today, we are going to explore how Japanese candlestick pattern are formed, understand their internal structure, and learn about the significance of open and close prices in trading.
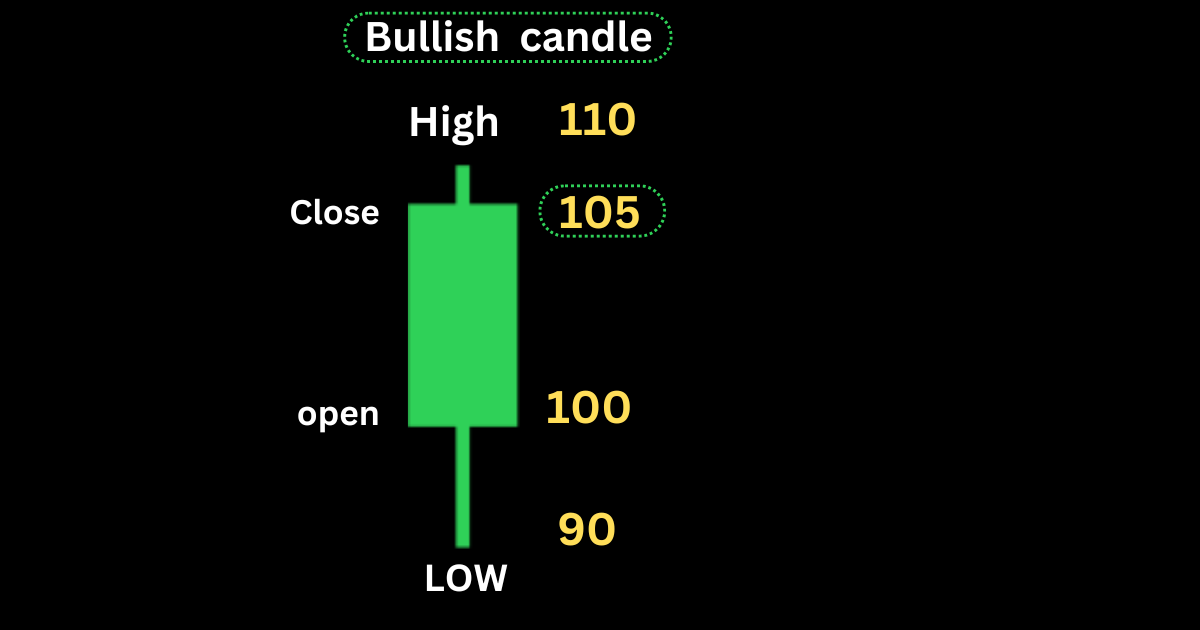
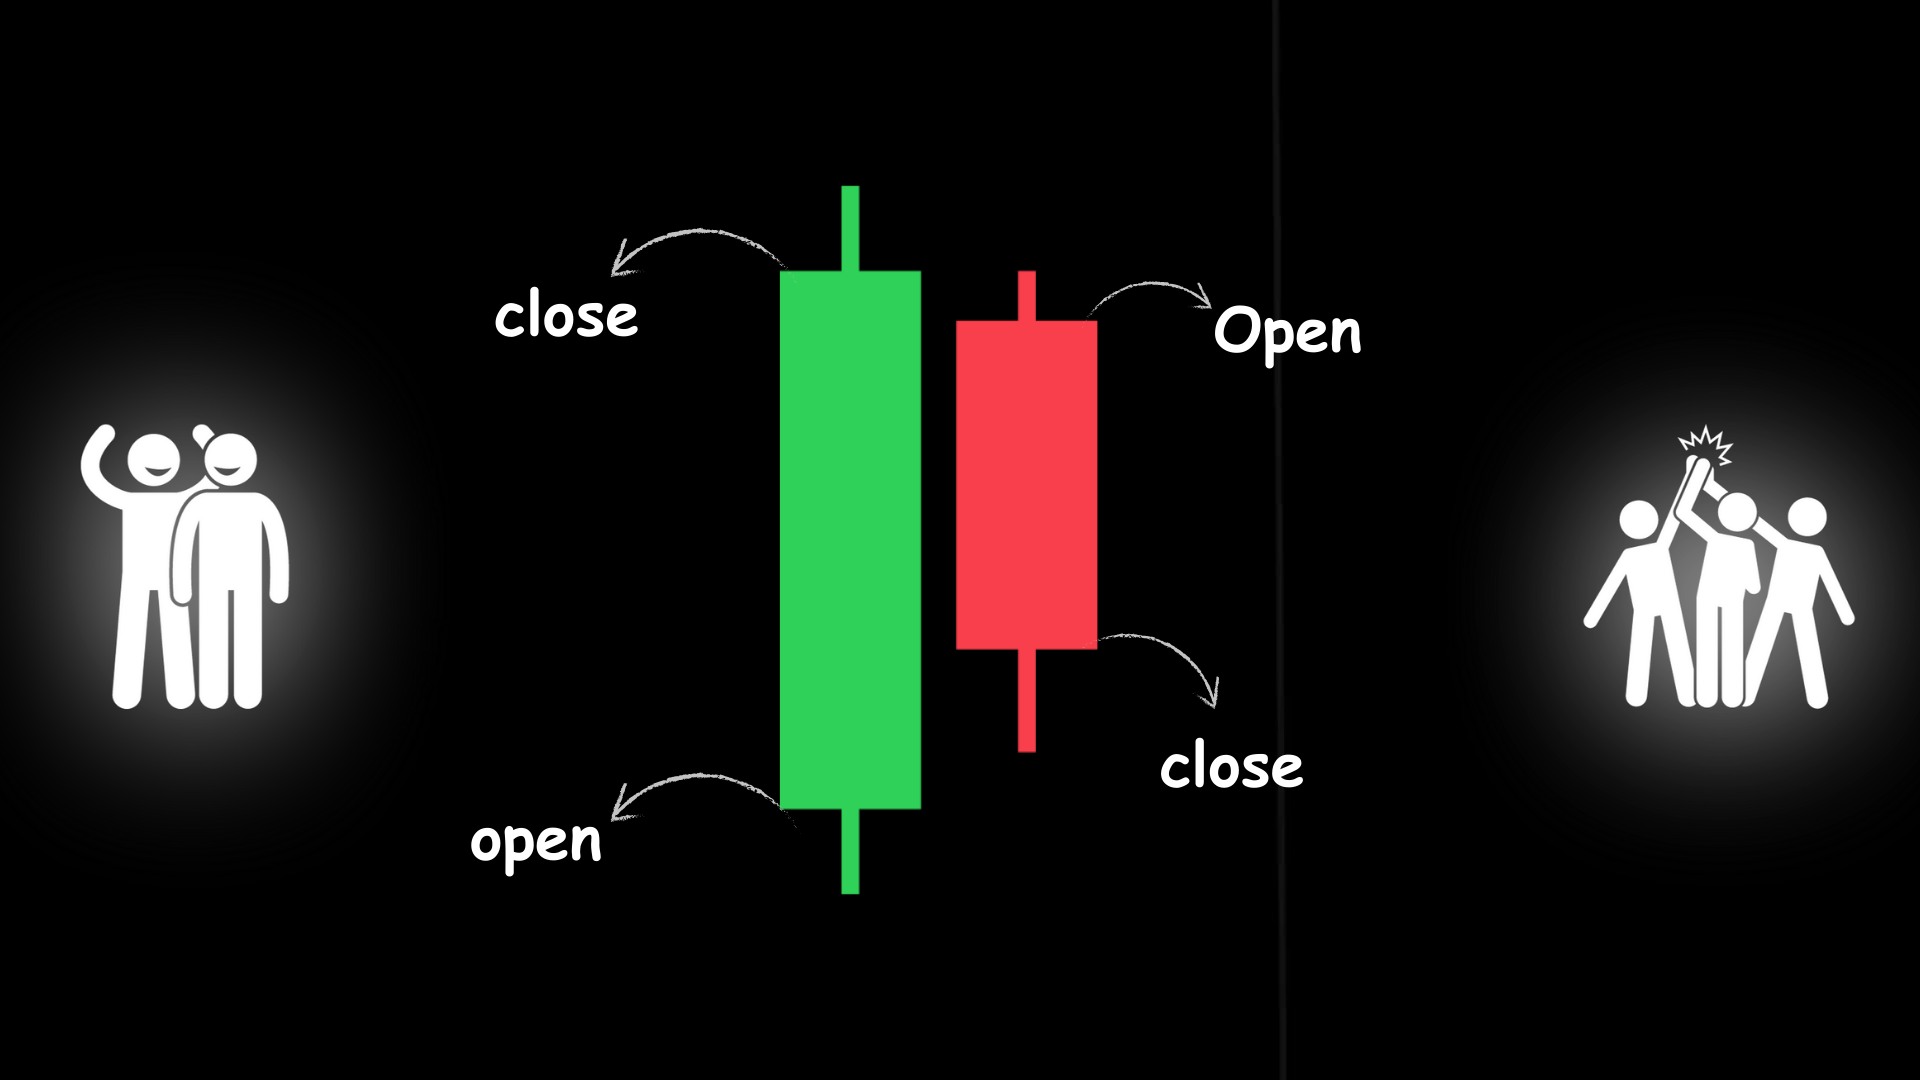
Bullish candle formation
In Japanese candlestick pattern formation let’s Imagine a stock’s price opens at ₹100. After some time, the stock price drops to ₹90, but by noon, it gains momentum and rises to ₹110. Finally, by the end of the day, the stock closes at ₹105.
Since the market closes at ₹105, which is higher than the opening price of ₹100, this indicates a positive gain. Hence, we represent this as a green candlestick.
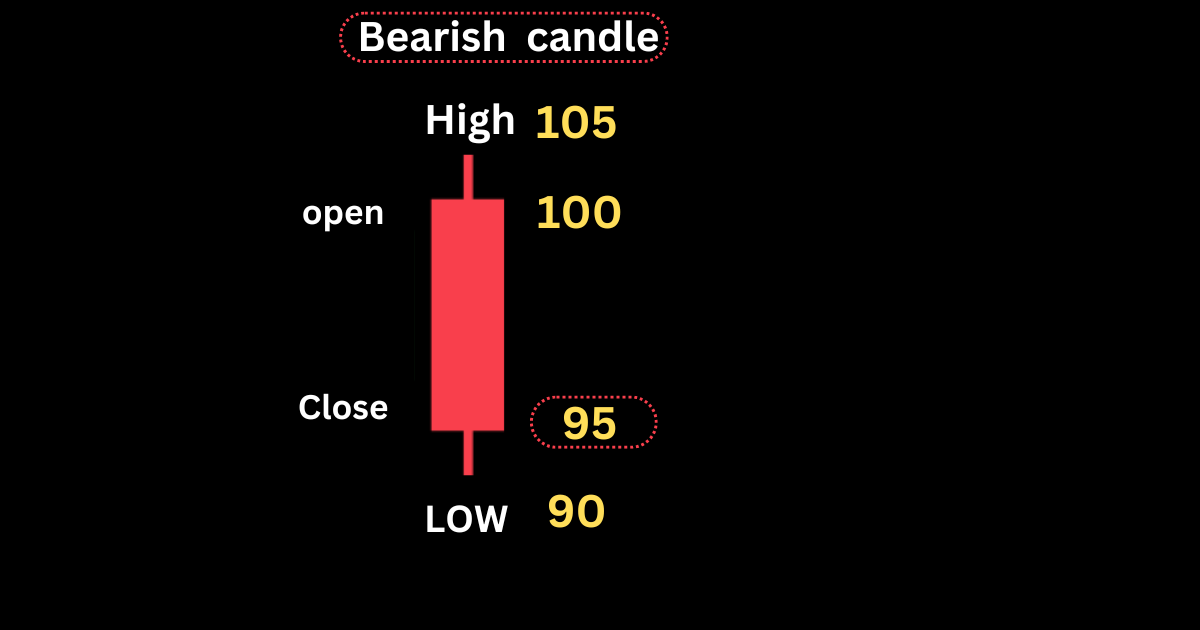
Bearish candle formation
Conversely, if a stock opens at ₹100 and rises to ₹105, but then loses momentum and drops to its lowest point of ₹90 by noon, eventually closing at ₹95, this indicates a loss. Therefore, we represent this as a red candlestick.
This candlestick opened at ₹100, had a high of ₹105 and a low of ₹90, and finally closed at ₹95.
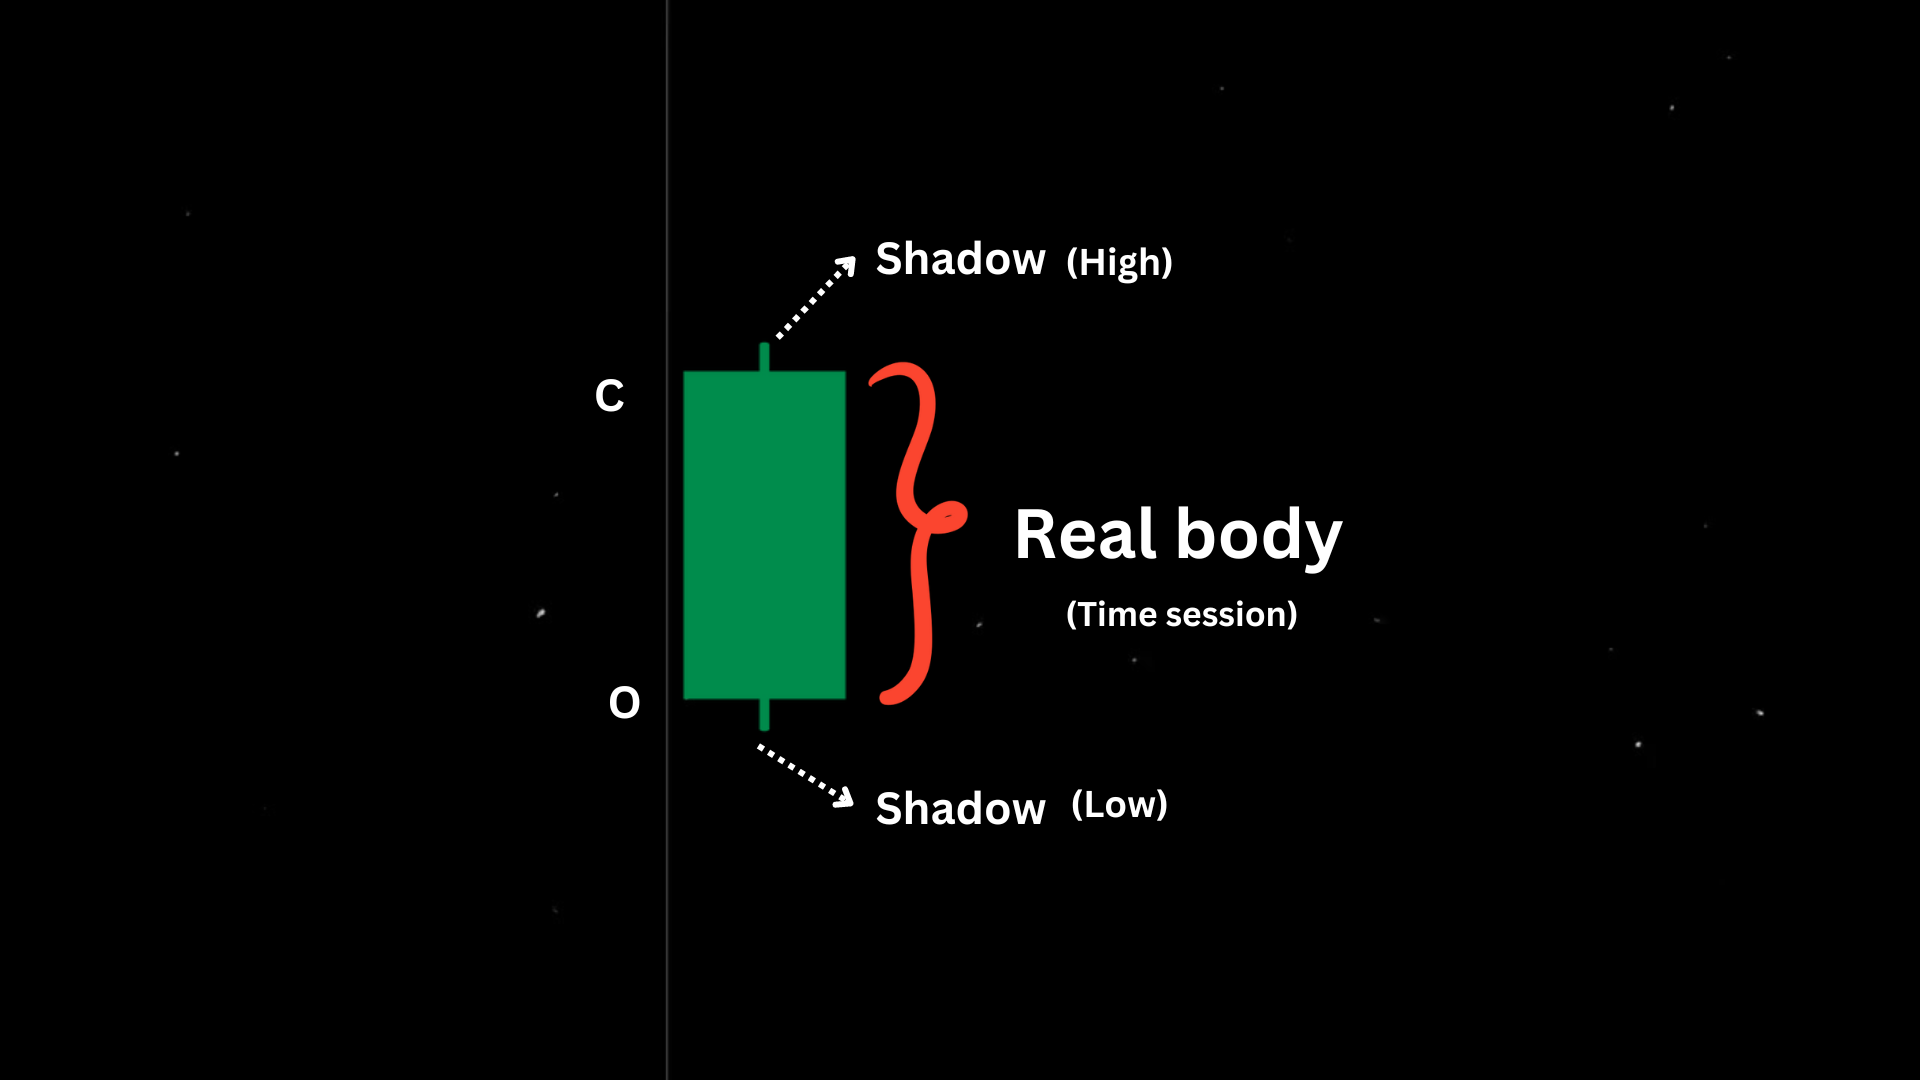
candlestick nomenclature
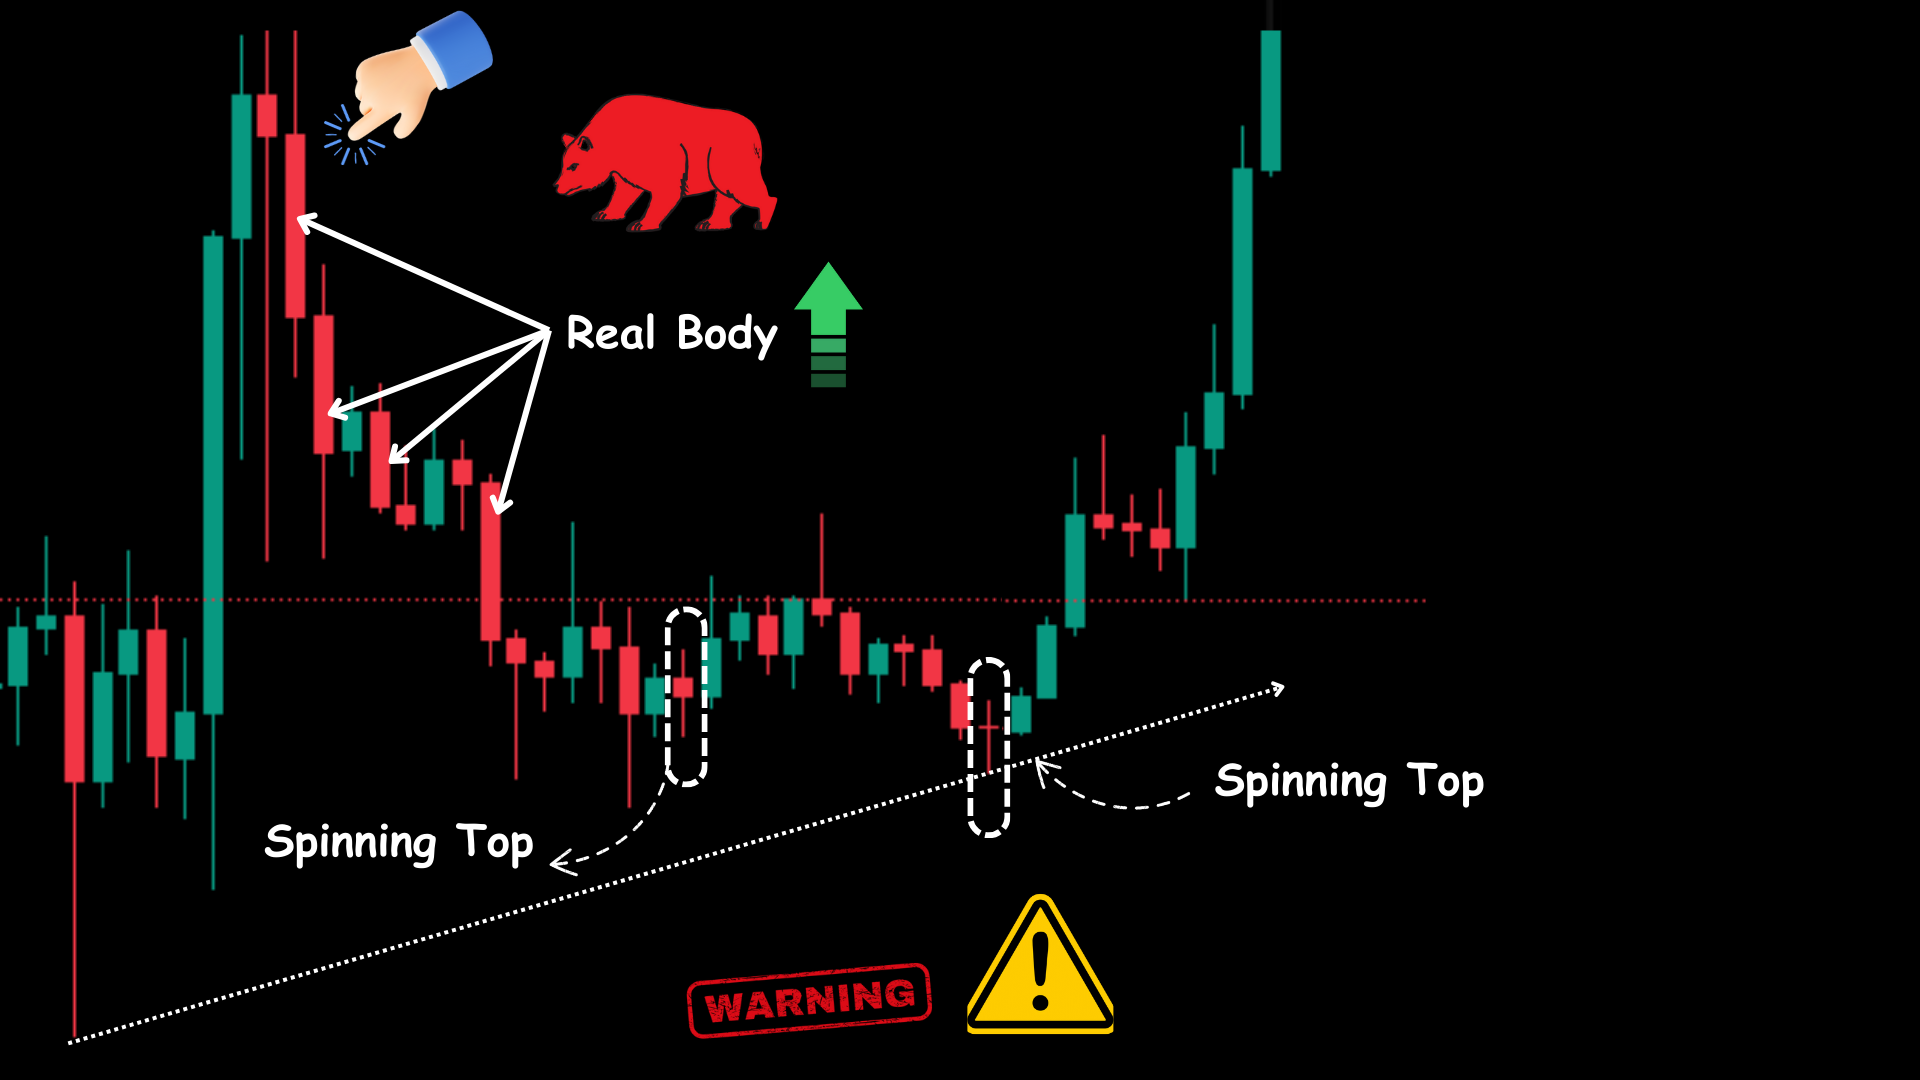
In Japanese candlestick pattern formation ,The rectangular section of the candlestick is called the real body, representing the session’s open and close.
The thin lines above and below the real body are called shadows, indicating the high and low prices.
The Japanese view the real body as the basis of price movement; by observing its height and color, we can infer whether bulls or bears are in control.
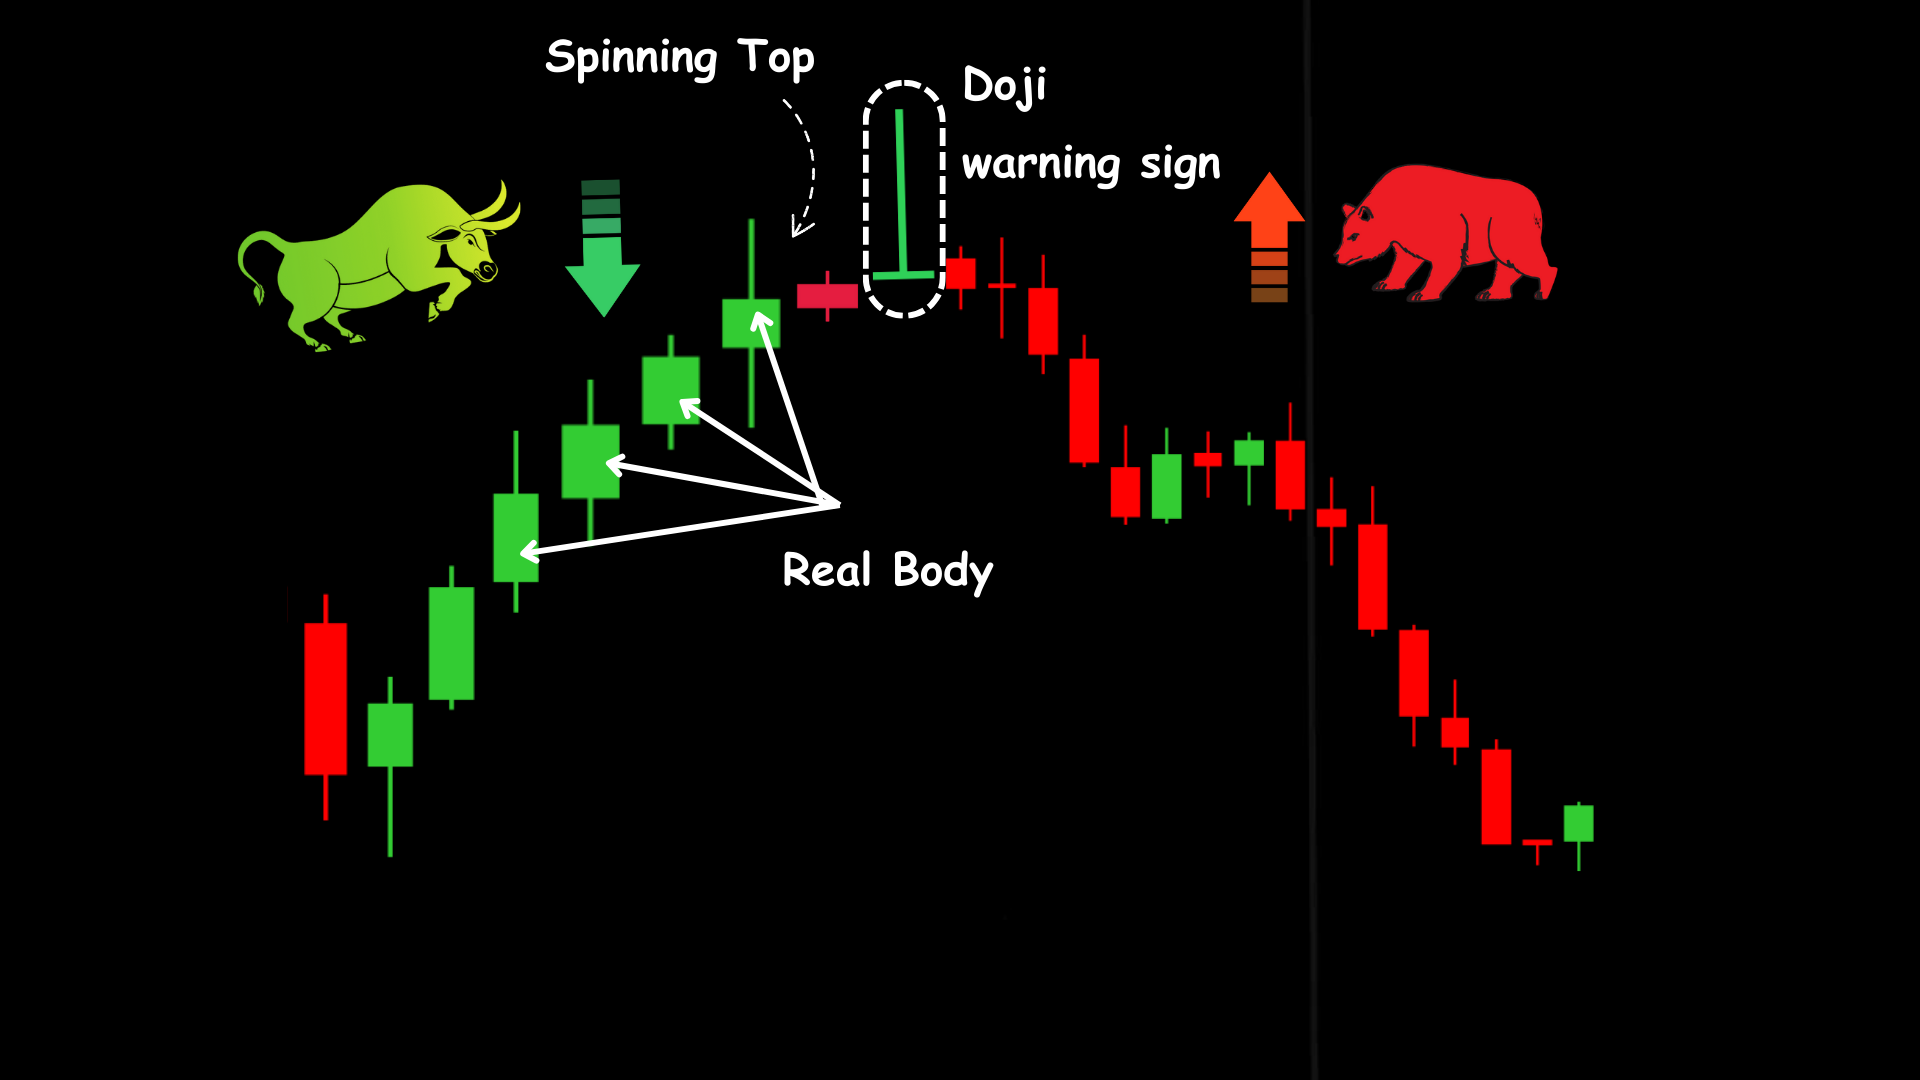
Example
Let’s understand Japanese candlestick pattern formation with an example: As the market rises, the height of the real body decreases, indicating that buyers are losing strength while sellers are gaining power.
Eventually, the real body becomes so small that it forms a spinning top, and finally, a doji forms, indicating that sellers are in full control and the market is about to fall.
Spinning tops and dojis are reversal patterns and are key components in formations like morning stars, evening stars, and hammers.
When the real body loses its momentum and a spinning top forms into a doji, it serves as a warning that the market’s strength is waning, increasing the likelihood of a market reversal.
Similarly, we can estimate the reversal of a downtrend. Remember, we can estimate but not confirm.
Example 2
In this chart, as the market falls, the size of the red candlestick increases, indicating that sellers are in full control. However, suddenly a spinning top appears, suggesting that sellers are losing their momentum.
This can be taken as a reversal warning sign. If we closely observe the spinning top, it is formed on a rising support line, giving us two reversal signals: a spinning top and a spinning top on a rising support line.
Open & Close Significance
In Japanese candlestick pattern formation, the open and close prices are very significant as they are two emotionally charged points of the trading session.
The first hour of the market often determines the direction for the entire day as it filters the news and rumors from the previous day, setting the main direction.
The way the market closes is also important as it helps decide the breakout and direction for the next session. Many technical indicators, like moving averages, are based on closing prices.

In upcoming series, we will delve deeper into candlestick patterns.


I was just as enthralled by your work as you were. The visual display is refined, and the written content is of a high caliber. However, you seem anxious about the possibility of delivering something that could be perceived as questionable. I believe you’ll be able to rectify this situation in a timely manner.